Hazard Exposure Assessment Dashboard
Personal geospatial dashboard to automate hazard exposure metrics and visualization for large asset portfolios.
Project details
→
Case studies highlighting climate risk modeling, geospatial analytics, and remote sensing workflows—focused on methodology, outputs, and decision-ready insights.
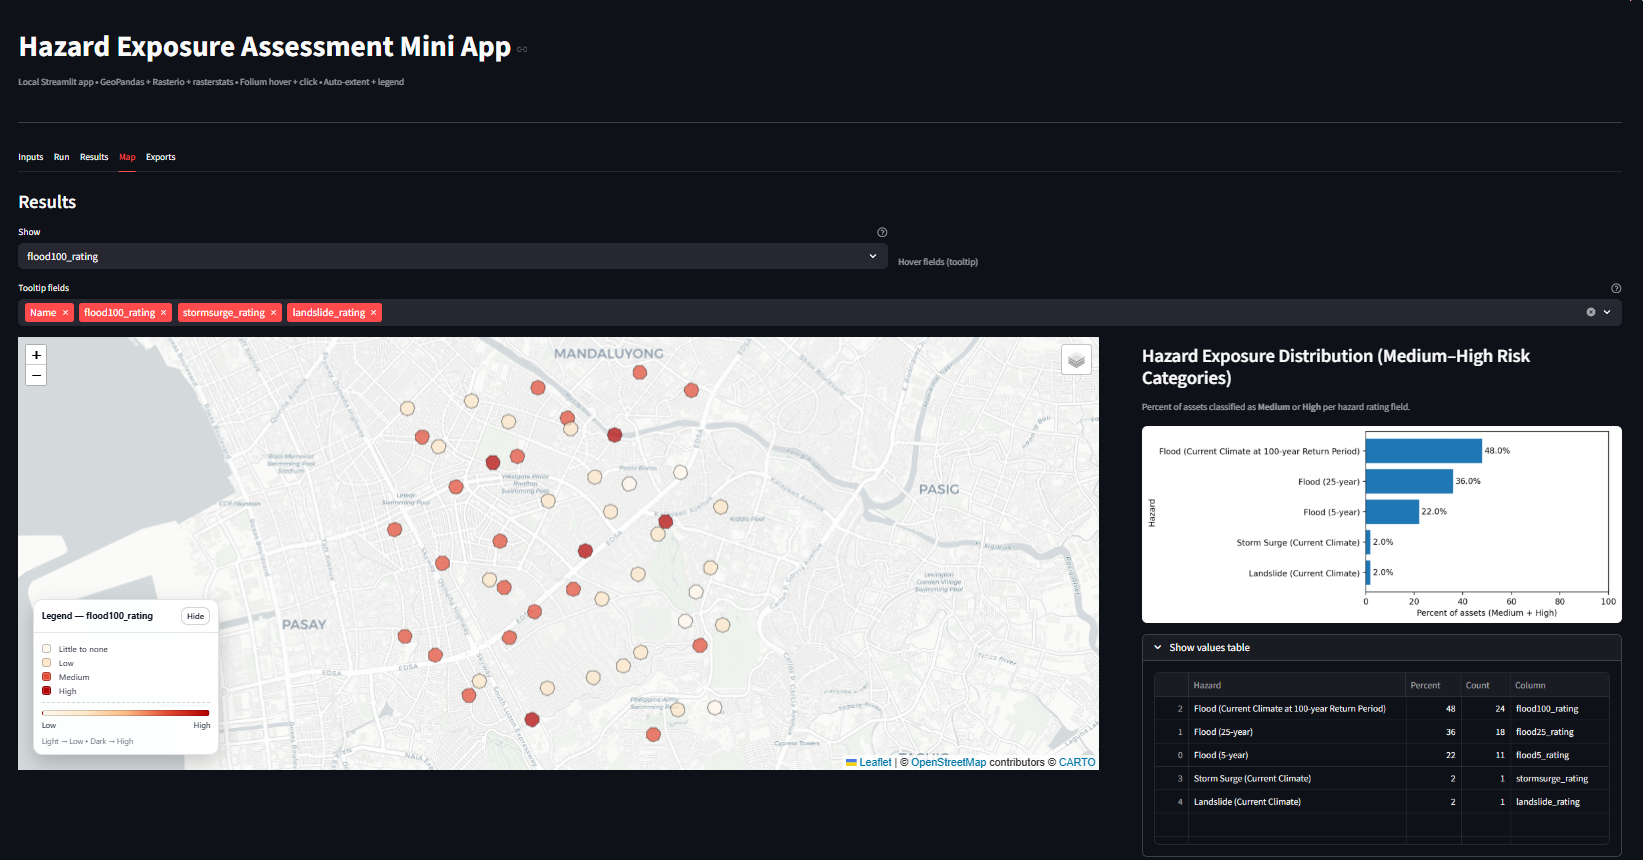
Personal geospatial dashboard to automate hazard exposure metrics and visualization for large asset portfolios.
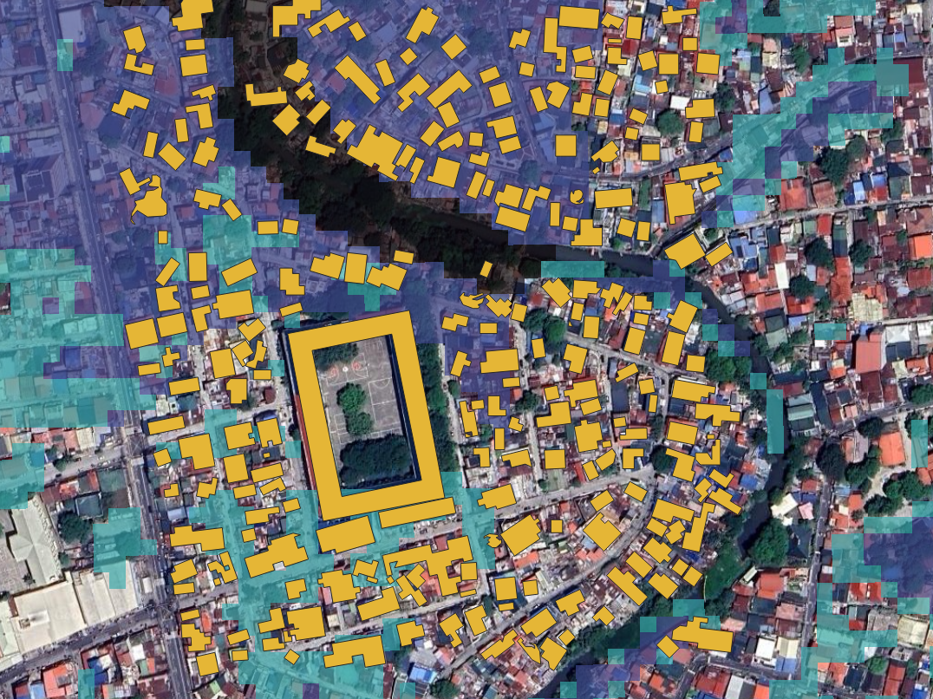
Standardized framework integrating local and global datasets to assess exposure under current and future climate scenarios.
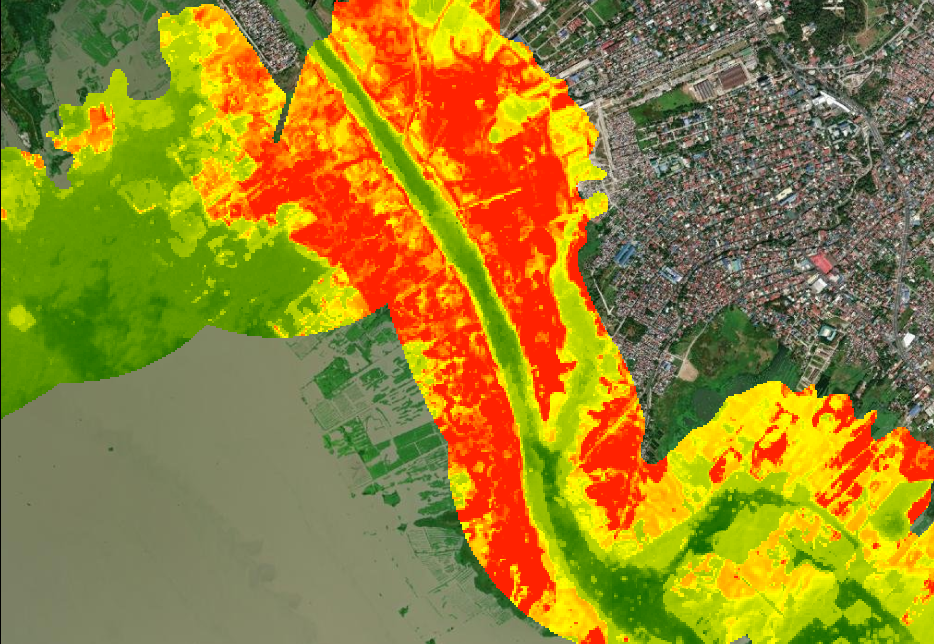
Utilized Google Earth Engine, satellite imagery, and rainfall data to analyze spatiotemporal patterns of river turbidity and identify areas with potential siltation risk.
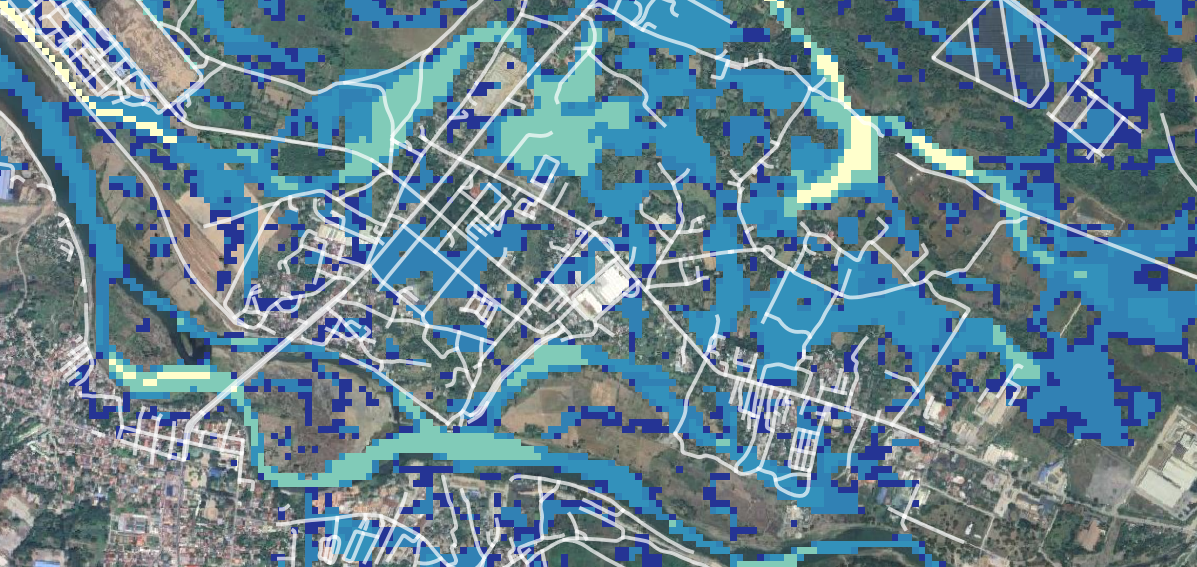
Hydrodynamic simulations generating flood depth and extent maps to support hazard interpretation and planning.
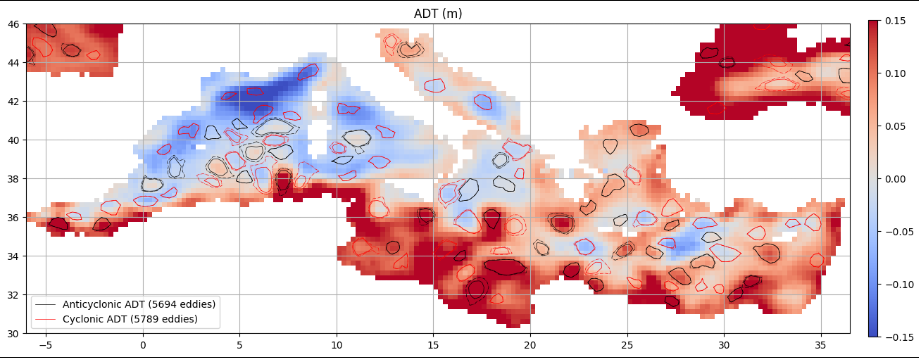
Processed multi-year NetCDF datasets in Python to detect mesoscale eddies and track lifecycle evolution.
A confidential-client methodology overview, plus a real, live VM0033 implementation across all 28 coastal provinces of Vietnam on Google Earth Engine.
Sample case study: identifying ARR-eligible areas that can be restored by planting coffee, cacao, or bamboo.
Interactive demo: enter your own parameters and generate a ranked suitability table across anonymized sample locations.