Enhancing Vs30 Mapping using HVSR Inversion
Poster presenter at GeoCon 2023 using HVSRInv (MATLAB) to estimate Vs30 for seismic hazard and site amplification, validated against Refraction Microtremor measurements.
Data & Spatial Analyst · Climate Risk Specialist
I turn geospatial and climate data into decision-ready risk insights, from hazard modeling and satellite analysis to automated data pipelines and spatial analytics. My toolkit spans Python, SQL, Google Earth Engine, and BigQuery/dbt, and I use AI as a thought partner throughout to move faster from raw data to answer.
6 years working across geospatial analytics, natural-hazard modeling, and physical climate risk, with experience spanning consulting, research, and applied data analysis.
Turning messy, multi-source datasets into decision-ready insights with Python, SQL, and automated reporting pipelines.
↗ 02TCFD-aligned exposure assessments, hydrodynamic flood and slope-stability models across multiple climate scenarios.
↗ 03Spatial analysis, satellite-derived indices, and Google Earth Engine workflows for environmental interpretation.
↗ 04Multi-criteria decision frameworks (AHP · TOPSIS) and scenario-based exposure comparisons for planning and investment.
↗ 05Executive dashboards, technical reports, and workshops that translate model outputs into clear recommendations.
↗ 06AI as a thought partner across the workstream, building and optimizing geospatial algorithms and automation scripts, plus self-directed exploration of AI's applications in GIS and climate-risk analytics.
↗I work across the full spatial-data workflow, from raw data and geoprocessing to modeling, automation, and decision outputs.
Core competencies mapped across two tracks: general data analysis and GIS/geospatial analysis, showing where the work is directly transferable versus specialized.
Swipe to see all columns →
| Skill area | Core tools | Data Analyst | GIS Analyst |
|---|---|---|---|
| Data analysis & statistics | Python (pandas, NumPy), SQL, exploratory & statistical analysis | ✓ | ✓ |
| Data visualization & dashboards | Tableau, Streamlit, executive reporting | ✓ | ✓ |
| Automation & scripting | Python, Bash, Selenium web scraping, workflow automation | ✓ | ✓ |
| Data QC & validation | Data cleaning, imagery / ML training-data QC, structuring | ✓ | ✓ |
| Decision & risk analytics | MCDA (AHP · TOPSIS), scenario modeling, exposure metrics | ✓ | ✓ |
| GIS & spatial analysis | QGIS, ArcGIS, spatial analysis, suitability mapping | – | ✓ |
| Remote sensing & earth observation | Google Earth Engine, satellite-derived indices, NetCDF | – | ✓ |
| Climate & hazard modeling | FLO-2D, hazard/slope-stability modeling, TCFD, RCP/SSP scenarios | – | ✓ |
| AI-assisted development | AI as workstream thought partner, AI-assisted scripting & automation, self-directed AI/GIS exploration | ✓ | ✓ |
| Cloud & data platforms | Google Cloud Platform (BigQuery), gcloud/bq CLI, dbt for pipeline builds and testing | ✓ | ✓ |
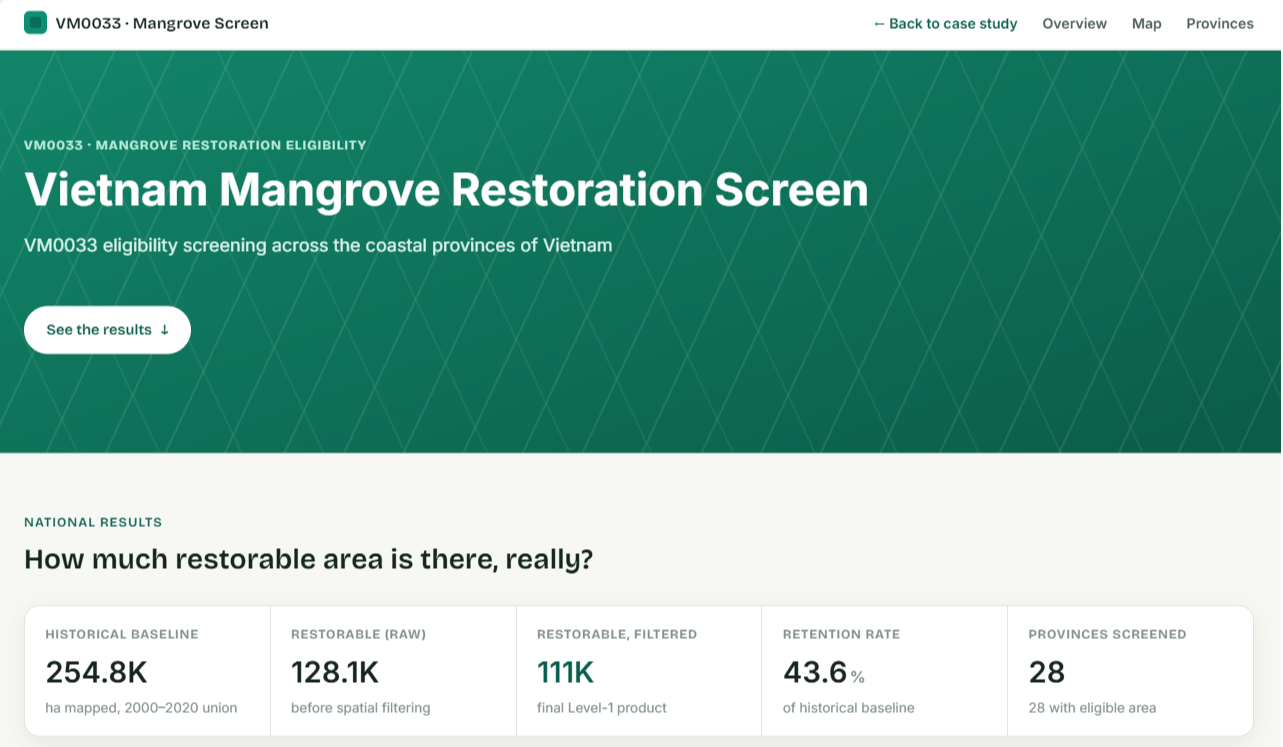
Live VM0033 eligibility screening across all 28 coastal provinces of Vietnam, computed on real public Earth Engine data, click into any province and step through the actual screening layers.
Read case study ↗
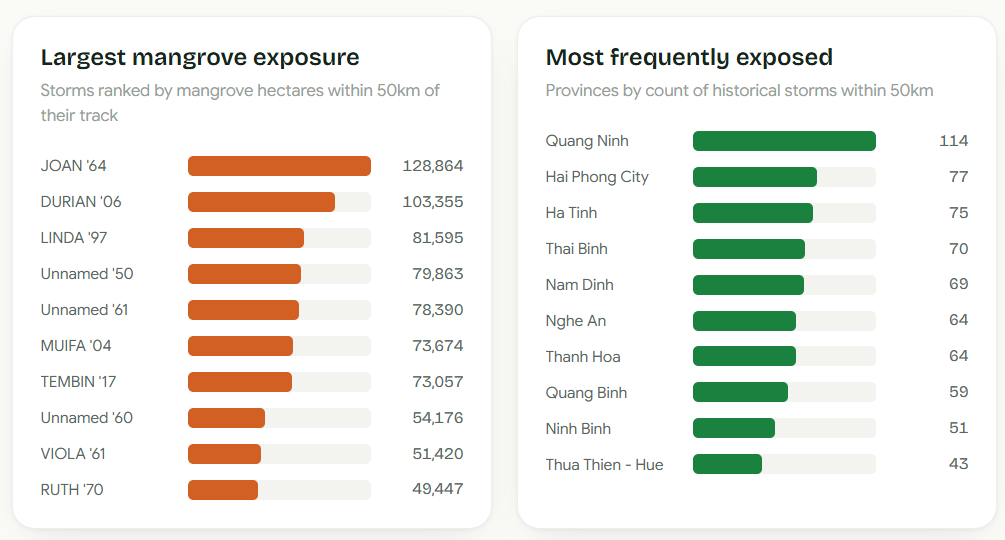
A self-directed data-engineering companion to the VM0033 work: historical cyclone tracks and mangrove extent, built into a real BigQuery/dbt pipeline, not just a one-off script.
Read case study ↗
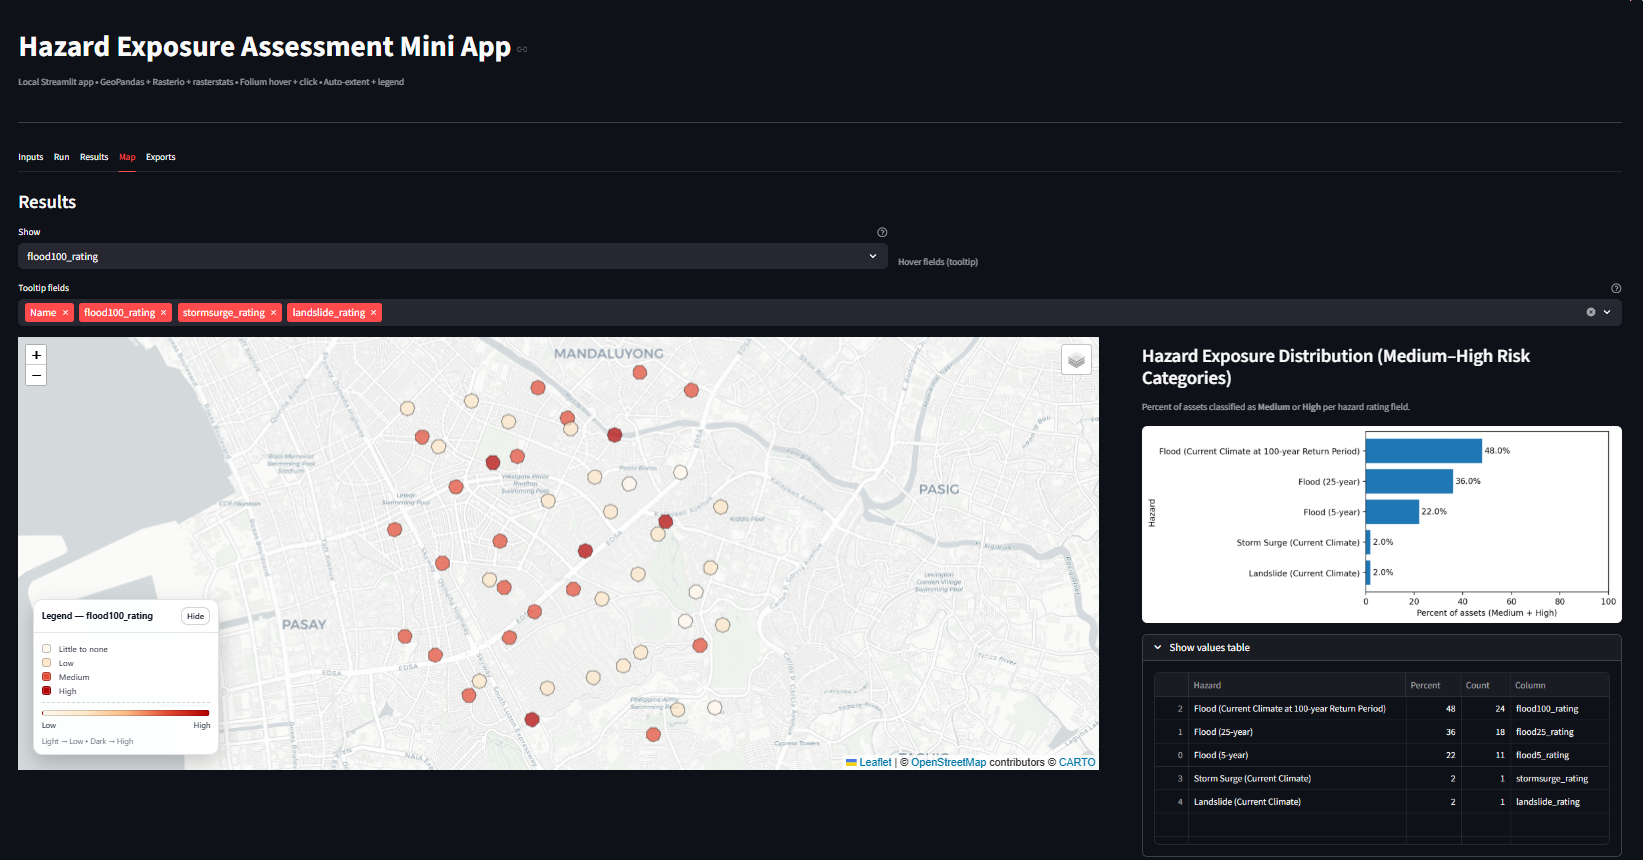
Built a personal Streamlit dashboard to standardize and automate hazard exposure assessments, turning a repeatable manual analysis into a self-serve tool.
Read case study ↗
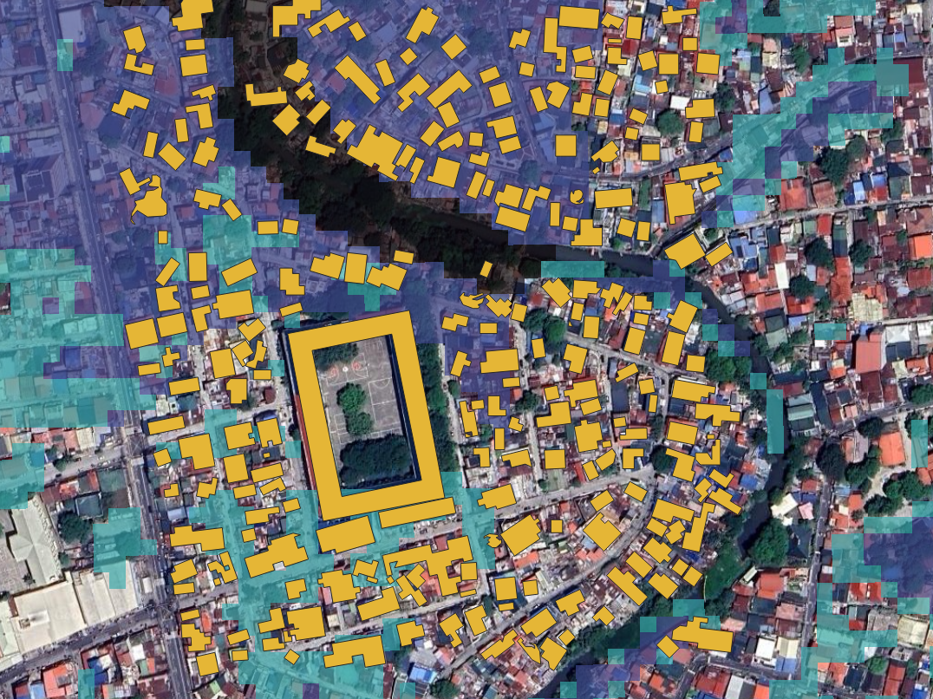
A standardized framework integrating local and global datasets, turning inconsistent one-off assessments into a scalable, current-and-future-scenario analysis.
Read case study ↗
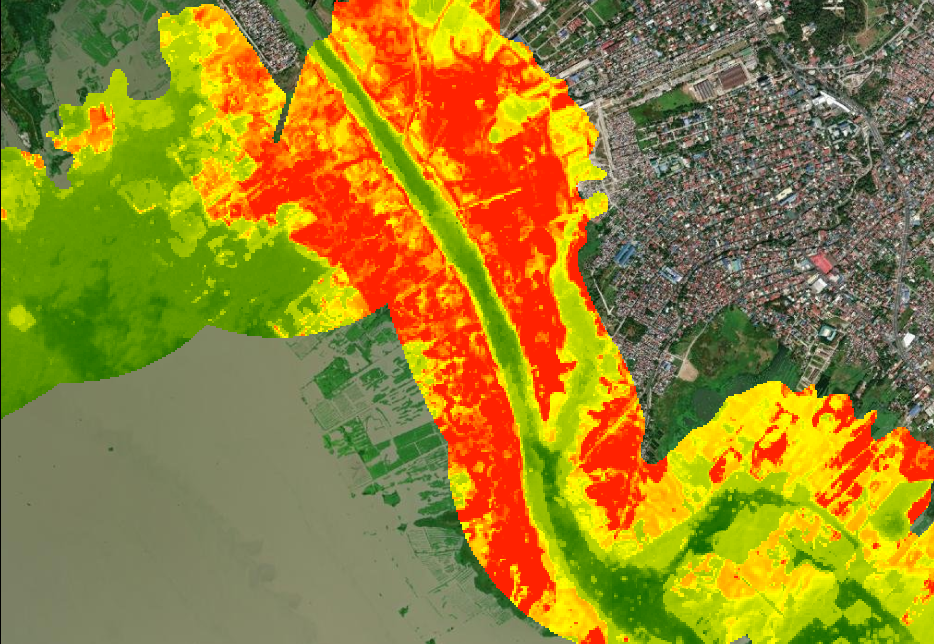
A Google Earth Engine analysis linking monthly rainfall patterns with satellite-derived turbidity to flag potential siltation zones.
Read case study ↗
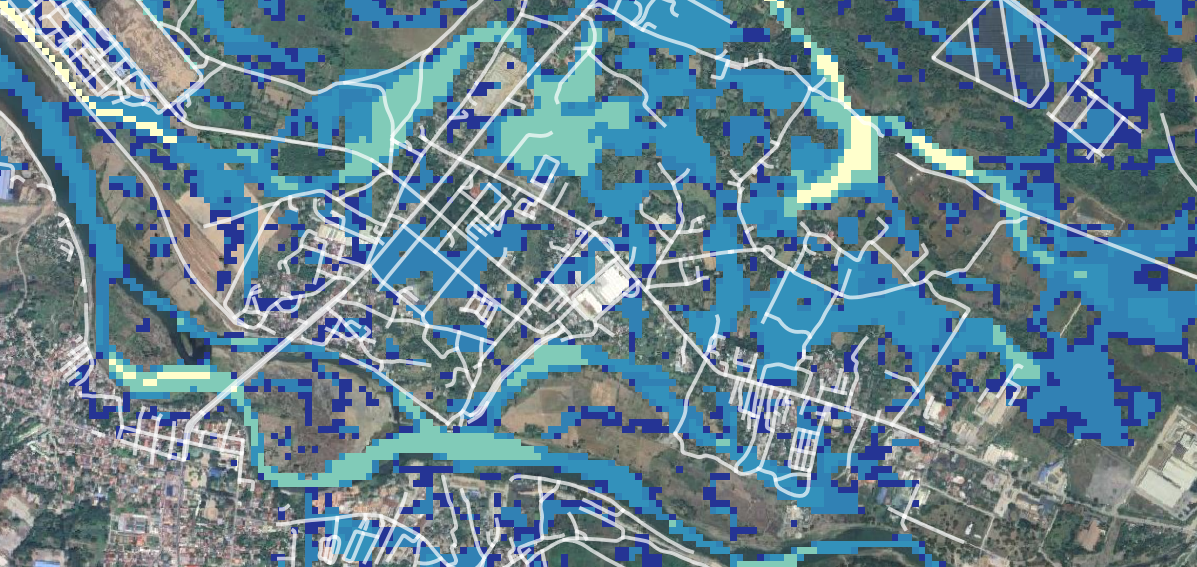
A 2D hydrodynamic modeling workflow simulating flood behavior under different scenarios, turning terrain and rainfall inputs into depth and extent maps hazard planners can act on.
Read case study ↗
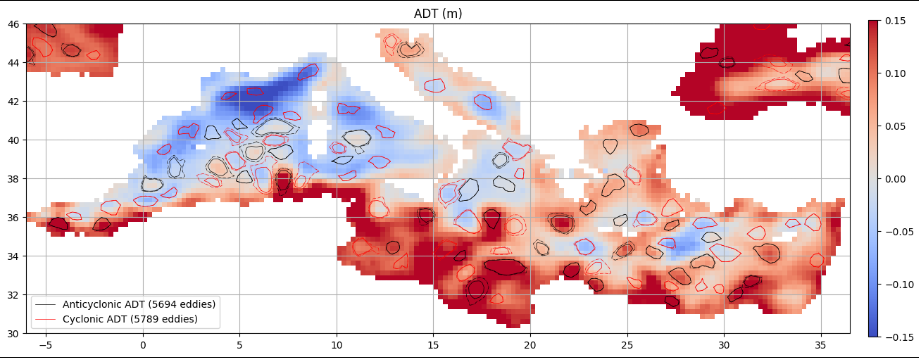
Built a Python-based workflow to detect and track mesoscale eddies across multi-year NetCDF data, turning large scientific datasets into spatial and temporal features analyzable at scale.
Read case study ↗Conference presentations and research supporting multi-hazard and geospatial analytics work.
Poster presenter at GeoCon 2023 using HVSRInv (MATLAB) to estimate Vs30 for seismic hazard and site amplification, validated against Refraction Microtremor measurements.
Curated 54 cultural and historical records documenting “lost rivers” shaped by urban growth to surface links between buried waterways, flood memory, and community-led regeneration.
Geospatial framework analyzing interactions between multiple hazards, including cascading and compounding effects, supporting disaster risk assessment and resilience planning.
Remote sensing and geospatial analysis to characterize volcanic features within Benham Rise, supporting interpretation of submarine structures and regional geologic evolution.